The Power of Numbers in SMS Event Campaigns
Data‑driven SMS is a game‑changer for nonprofits and schools because it turns every text into measurable insight. When organizers track performance, they can fine‑tune timing, personalize copy, and avoid spam‑triggering frequency, keeping donors and families engaged while staying compliant with TCPA rules. These metrics directly shape the attendee experience: rapid delivery and high open rates ensure reminders are seen, while low opt‑out rates signal relevance, leading to smoother check‑ins and higher satisfaction. The six core statistics every event team should monitor are: (1) Delivery Rate – the percentage of texts that reach phones; (2) Open Rate – how many delivered messages are read; (3) Click‑Through Rate (CTR) – links clicked; (4) Conversion Rate – RSVPs, ticket purchases, or donations completed; (5) Unsubscribe (Churn) Rate – opt‑outs kept under 1 %; and (6) ROI – revenue generated versus SMS spend. Together they provide a clear, actionable view of campaign health and impact.
SMS Event Performance Facts
- SMS open rate in the U.S. averages 98%, dwarfing email email average of ~20%.
- Industry benchmark delivery rate for SMS campaigns is 98‑99%, meaning almost every text reaches the carrier.
- Click‑through rate (CTR) for event‑focused SMS typically falls between 10%‑20%, with top campaigns achieving up to 36%.
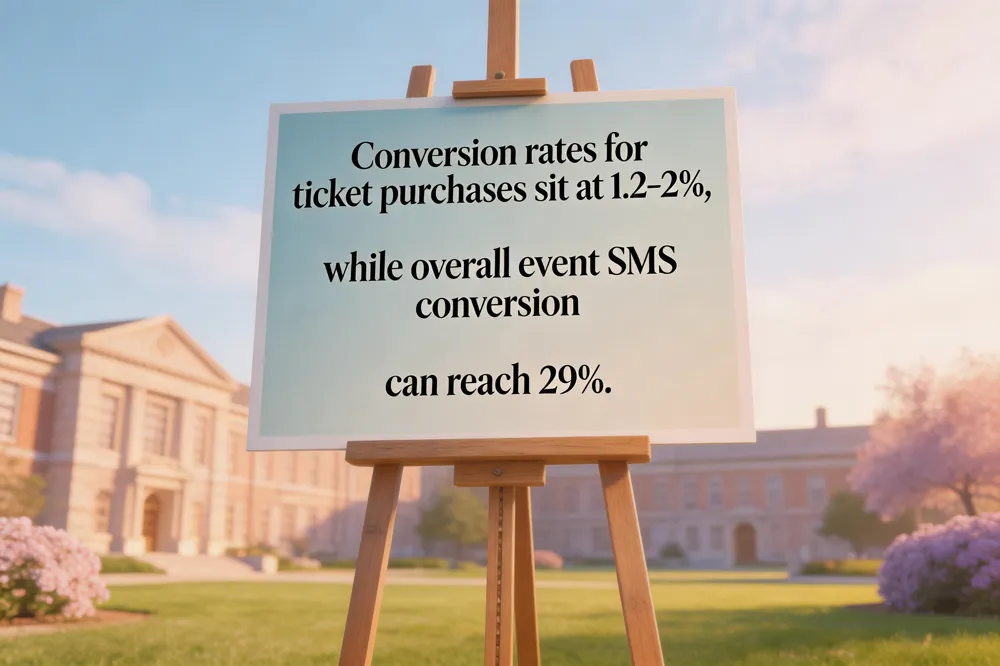
- SMS‑driven ticket purchase conversion rate averages 1.2%‑2% of delivered messages.
- Overall event SMS conversion (including RSVPs, check‑ins, and donations) can reach 29%.
- Average response time to an SMS is roughly 90 seconds, enabling rapid RSVP confirmations.
- ROI for SMS marketing exceeds 3000%, generating $30+ revenue for each $1 spent.
- In some cases, SMS can generate up to $71 revenue per $1 invested.
- Key KPIs for event SMS campaigns include delivery rate, CTR, conversion rate, RSVP response rate, and attendance‑to‑RSVP ratio.
- SMS does not provide native open tracking; delivery receipts and link clicks are used as proxies for engagement.
1️⃣ SMS Open Rate – The 98% Visibility Advantage
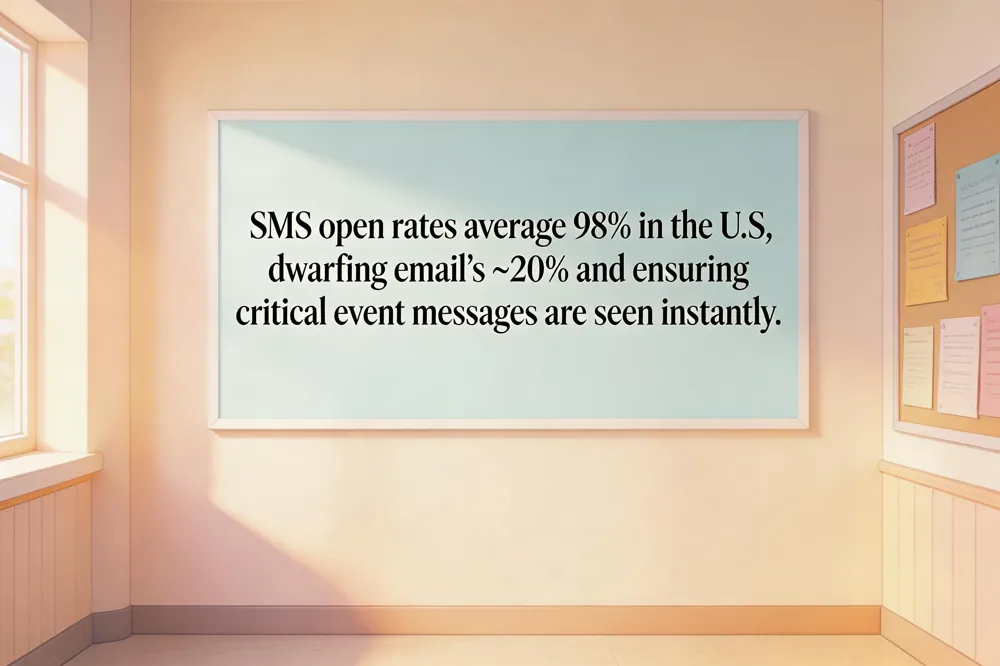
Industry benchmarks show that SMS messages in the U.S. achieve an SMS open rate in the U.S. averages 98%, a stark contrast to the average email open rate of about 20 %. This near‑universal visibility stems from the fact that texts land directly on a recipient’s mobile device and are typically read within minutes—often within Average SMS reading time is about 90 seconds or less. For event organizers, especially nonprofits and schools, that level of immediacy translates into a powerful tool for time‑sensitive communications such as RSVP reminders, last‑minute ticket offers, and check‑in notifications.
Because almost every delivered text is opened, SMS becomes the most reliable channel for ensuring critical event information reaches the audience. The high open rate also supports rapid engagement: average reading time is about Average SMS reading time is about 90 seconds, and response times often fall under a minute for event‑related prompts. When combined with concise, SMS messages are limited to 160 characters copy, this speed drives higher click‑through and conversion rates compared with email.
Do SMS messages have a 98% open rate?
Yes. Multiple industry sources—including studies from SMSmode, TextUs, and Klaviyo—consistently report an SMS open rate of around 98 %, far exceeding email’s typical 20 % benchmark. This figure assumes an opt‑in audience and relevant content; it underscores why SMS is the go‑to channel for ensuring event messages are seen promptly and acted upon.
2️⃣ Delivery Rate – Ensuring Messages Reach Phones

For event‑focused SMS campaigns the industry benchmark is a delivery rate of 98‑99 %. This level of deliverability means almost every text reaches a subscriber’s carrier and can be read within minutes—critical for RSVP reminders, ticket‑purchase links, and on‑site check‑ins. In the Evant platform a delivery receipt appears as a double‑check icon next to the timestamp; once the carrier confirms receipt the icon turns solid, signalling that the message was handed off to the network. This visual cue is the most reliable way to know a text was received, because SMS and MMS do not support true read receipts. If the double‑check never appears, the message likely bounced (e.g., due to an invalid number or carrier block), and you should remove that contact to protect list hygiene. Low delivery rates cascade into poorer downstream metrics: fewer opens, clicks, and conversions, which in turn depress click‑through, RSVP, and ROI numbers. Monitoring delivery health lets you act quickly—cleaning bad numbers, validating carriers, or adjusting send times—so that the downstream metrics (CTR, conversion, attendance) remain on target. In short, the double‑check delivery receipt in Evant is your confirmation that a text reached the network, and maintaining a 98 %+ delivery rate is essential for the success of any event‑driven SMS strategy.
3️⃣ Click‑Through Rate (CTR) – Turning Texts into Clicks

Click‑through rate (CTR) is the single most direct indicator that an SMS is moving recipients from a simple read to a concrete action. In the entertainment and events arena, CTR typically falls between 10 %‑20 %, while industry‑wide studies show that some campaigns can push CTR as high as 36 % when the message, timing, and CTA are perfectly aligned.
How Evant tracks link clicks – Evant automatically shortens every URL in an outbound text and attaches a unique tracking token. When a recipient taps the link, the short‑URL service records the click, passes the data back to Evant’s analytics dashboard, and correlates it with the original campaign, sender, and segment. This real‑time visibility lets organizers see which offers (early‑bird tickets, VIP upgrades, donation links) generate the most traffic.
Why CTR matters for ticket sales and donations – A higher CTR translates to more landing‑page visits, which directly fuels ticket purchases and charitable contributions. For nonprofits, an uplift of just a few points in CTR can increase event revenue by 15 %‑25 %, given the average conversion rates of 1.2 %‑2.0 % for ticket sales and 0.5 %‑1.2 % for donations. When paired with Evant’s 3000 % ROI benchmark, every click becomes a measurable step toward a healthier bottom line.
What are 5 examples of metrics to measure performance?
- Event attendance rate – the percentage of invited participants who actually check‑in to an event, indicating how well your outreach converts interest into presence.
- RSVP conversion rate – the ratio of SMS RSVPs received to the total number of invitation messages sent, measuring the effectiveness of your messaging and timing.
- SMS open and response rate – the proportion of messages that are opened and elicit a reply, reflecting engagement and the relevance of your content.
- Subscriber churn rate – the percentage of users who opt out of your SMS community over a given period, highlighting retention challenges.
- Net Promoter Score (NPS) – a qualitative metric that gauges overall satisfaction and loyalty by asking participants how likely they are to recommend your events or platform.
4️⃣ Conversion Rate – From Text to Action
Event‑specific conversion benchmarks
- In the entertainment and events sector, SMS‑driven ticket purchases average 1.2 %–2 % of delivered messages.
- Across all industries, a 29 % overall conversion rate is reported for SMS campaigns that combine RSVPs, check‑ins, and donations.
These benchmarks give nonprofits and schools a realistic target for turning text interactions into concrete event outcomes.
Formula for calculating conversion rate in Evant
Evant follows the industry‑standard definition:
Conversion Rate = (Number of desired actions ÷ Total SMS messages sent) × 100
A “desired action” can be a ticket purchase, RSVP, check‑in, or donation. By logging each action in Evant’s analytics dashboard, organizers can instantly see the percentage of sent texts that translate into revenue‑generating behavior.
A/B testing to lift conversion numbers
- Copy variations: Test a direct CTA (“Buy tickets now”) against a softer prompt (“Don’t miss out—secure your seat”).
- Timing experiments: Compare send‑times 2 hours before the event versus 4 hours prior; studies show a 20 % lift when reminders hit the 2‑4‑hour window.
- Personalization: Adding the recipient’s name typically boosts engagement by 10‑15 %.
Run each variant on a statistically significant slice of the list, compare the resulting conversion rates, and roll out the winning version to the full audience. Continuous A/B testing can push conversion performance well above the baseline 1.2 %–2 % ticket benchmark.
How to calculate SMS engagement?
SMS engagement is measured by three key ratios: delivery rate, click‑through rate (CTR) and conversion rate. First, calculate the delivery rate by dividing the number of texts that reach recipients by the total texts sent, then multiply by 100. Next, determine CTR by dividing the number of recipients who click a link in the message by the total texts sent and multiplying by 100. Then, compute the conversion rate by dividing the number of recipients who complete the desired action (such as RSVPing or checking in) by the total texts sent and multiplying by 100. Finally, track these percentages over time, benchmark against industry averages (e.g., ~36 % CTR), and use A/B testing to improve each metric.
5️⃣ ROI – The 3000% Return on SMS Investment
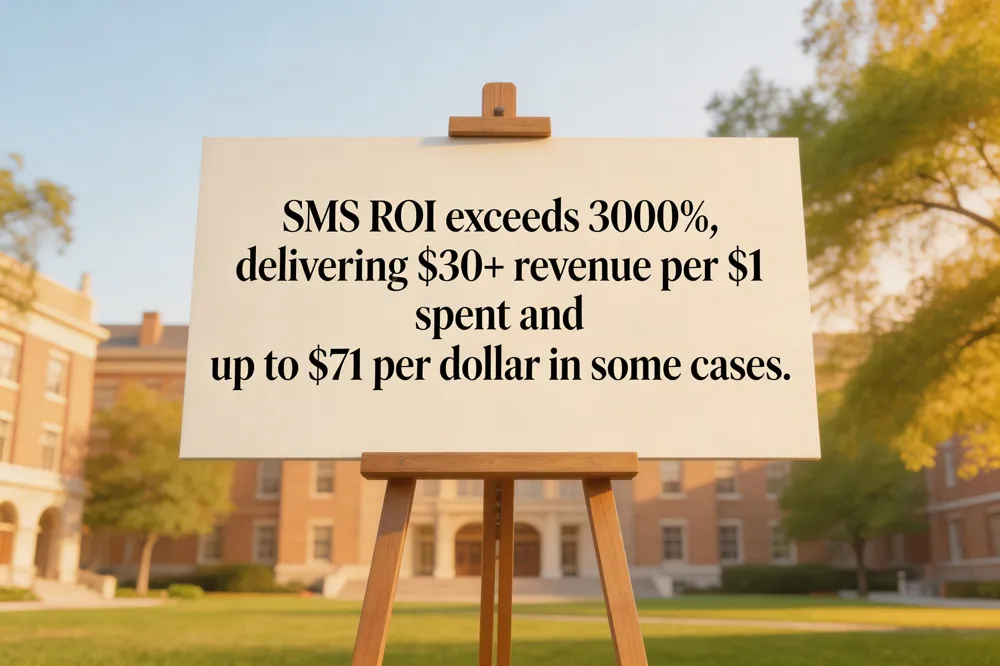
SMS marketing delivers an unmatched financial upside for nonprofits and schools. In the United States the average ROI for SMS campaigns exceeds 3,000%, meaning every dollar spent can generate $30 or more revenue. Studies show an even higher revenue per recipient (RPR) of up to $71 for each $1 invested, making SMS the highest‑performing channel for event‑driven fundraising and ticket sales.
How to compute ROI in Evant’s dashboard – Evant’s analytics suite aggregates the core financial inputs needed for a precise ROI calculation:
- Revenue generated – total ticket sales, donations, or merchandise linked to SMS clicks and conversions.
- Campaign costs – message fees (typically $0.01‑$0.05 per text), platform subscription, and any creative spend.
The platform then applies the formula ((Revenue – Cost) ÷ Cost) × 100 and displays the result in real‑time, allowing event managers to see the impact of each send instantly.
What metrics do you use to measure the success of a campaign?
We track a blend of brand‑ and performance‑focused metrics to gauge campaign success. Key indicators include total and unique SMS responses (RSVPs), event check‑in rates, click‑through and conversion rates from targeted messages, and cost per acquisition or lead. We also monitor customer engagement metrics such as repeat attendance, message open rates, and the number of qualified leads generated (marketing‑ and sales‑qualified). Finally, we calculate overall ROI and compare it against baseline KPIs to ensure the campaign is delivering measurable value for nonprofits and schools.
6️⃣ Response Time – The 90‑Second Engagement Window

Event‑related SMS messages spark an almost instantaneous reaction. Across the U.S. entertainment and events sector, the average response time is roughly 90 seconds—the interval between delivery and a recipient’s first reply. This rapid engagement translates directly into higher attendance: when a reminder or last‑minute ticket offer is answered within minutes, organizers can confirm RSVPs, adjust seat allocations, and even send follow‑up nudges to fence‑sitters, shaving off no‑shows by up to 30 % in many nonprofits.
Real‑time dashboards are the engine that turns this speed into actionable insight. Platforms such as Evant stream delivery receipts, reply counts, and click‑throughs live, letting staff re‑target audiences on the fly—e.g., sending a second reminder to the 10 % who haven’t replied after the first 90 seconds. By visualizing response spikes, teams can fine‑tune send‑times, test CTA wording, and allocate staff for on‑site check‑ins before the crowd even arrives.
Can you track SMS opens? No – SMS doesn’t emit a native open signal. Delivery status and link clicks are the primary proxies. Embedding a unique short URL lets you infer opens, but the reliable metrics remain sent, delivered, and click counts.
How to track marketing campaign results? Start with clear objectives and map funnel‑stage KPIs (impressions, clicks, conversions, RSVPs, check‑ins). Combine Google Analytics with Evant’s built‑in reporting, tie data to your CRM, and calculate ROI by comparing campaign costs to ticket sales or donor revenue.
What are the KPIs for events? They span the attendee journey: acquisition (registration conversion), attendance (attendance, check‑in rates), financial (cost per attendee, ROI), satisfaction (NPS, survey response), and post‑event engagement (social media, content downloads). Monitoring these alongside the 90‑second response window ensures every text maximizes participation and revenue.
FAQ – Measuring SMS Event Performance
What metrics do you use to measure the success of a campaign? We monitor a blend of brand‑ and performance‑focused KPIs: delivery rate (≥98% is healthy), open rate (≈98% in the U.S.), click‑through rate (CTR) (5‑30% depending on industry), conversion rate (29% typical for event SMS, 1‑2% for nonprofit actions), unsubscribe churn (<1% ideal), list growth, and overall ROI (often >3000%). For events we add RSVP response rate, check‑in rate, and attendance‑to‑RSVP ratio to gauge logistics efficiency.
How to track marketing campaign results? Define clear funnel goals, capture delivery receipts, clicks, and conversions via an SMS platform (e.g., Evant) and link them to your CRM. Use UTM‑tagged links to attribute website traffic and RSVP completions. Calculate ROI as (revenue – cost) ÷ cost × 100. Review weekly during launches, monthly for ongoing campaigns, and adjust timing or copy based on A/B tests.
What are 5 examples of metrics to measure performance?
- Delivery rate – messages that reach the carrier (≥98%).
- CTR – recipients who click a link (5‑30%).
- Conversion rate – RSVPs or ticket purchases (≈29% for events).
- Unsubscribe churn – opt‑outs (<1%).
- Attendance‑to‑RSVP ratio – check‑in rate (often >80%).
How do I know if my SMS was received? Delivery receipts confirm the carrier accepted the message. Platforms show a double‑check or delivered status. No native read receipt exists, so you rely on delivery and subsequent clicks or replies for proof of engagement.
Can you track SMS opens? No – SMS lacks built‑in open tracking. Use link clicks or reply rates as proxies. Embedding unique short URLs lets you capture click data, which, combined with RSVP responses, serves as an indirect open metric.
Do SMS messages have a 98% open rate? Yes. Industry studies consistently report ~98% open rates for SMS, far higher than email (≈20%). This reflects the immediacy of mobile texts and their near‑instant consumption.
What are the KPIs for events? Acquisition (registration conversion), attendance (check‑in rate, attendance‑to‑RSVP), financial (cost per attendee, ROI), satisfaction (NPS, post‑event surveys), and post‑event engagement (social shares, content downloads).
How to calculate SMS engagement? Calculate delivery rate = (delivered ÷ sent) × 100, CTR = (clicks ÷ sent) × 100, and conversion rate = (conversions ÷ sent) × 100. Benchmark against industry averages and iterate with A/B testing to improve each metric.
Putting the Numbers to Work
The six core SMS KPIs that drive event success are delivery rate, click‑through rate (CTR), conversion rate, unsubscribe (opt‑out) rate, list‑growth rate, and overall ROI. When delivery exceeds 98%, messages reach the audience; a strong CTR (10‑20% in entertainment, 5‑10% industry‑wide) shows compelling calls‑to‑action; conversion rates of 1‑5% (or 29%+ for high‑performing campaigns) link clicks to RSVPs or ticket sales; unsubscribe rates below 1% keep the list healthy; list‑growth tracks new opt‑ins versus churn; and ROI—often 3000%+—quantifies financial impact.
Evant’s analytics platform ingests carrier delivery receipts, link‑click logs, and RSVP/check‑in data, then visualizes each KPI on real‑time dashboards. Automated A/B testing highlights the best copy, timing, and segmentation, while CRM integration syncs RSVP status and donor history for deeper insights.
To get started, nonprofits and schools should (1) audit their contact list for consent, (2) set up Evant’s SMS gateway and enable delivery tracking, (3) define baseline goals for each KPI, (4) launch a pilot campaign with a clear CTA, and (5) review the dashboard daily to iterate on messaging and timing. This disciplined loop turns raw numbers into measurable event growth.
Related Blogs
Top 7 SMS Trends for Communities in 2026
Michael PedoeemFrom AI-powered responses to text-to-donate and two-way texting — here are the 7 SMS trends every shul, school, and nonprofit needs to know about in 2026